Source In The Aisle.
Scan, Then Decide.
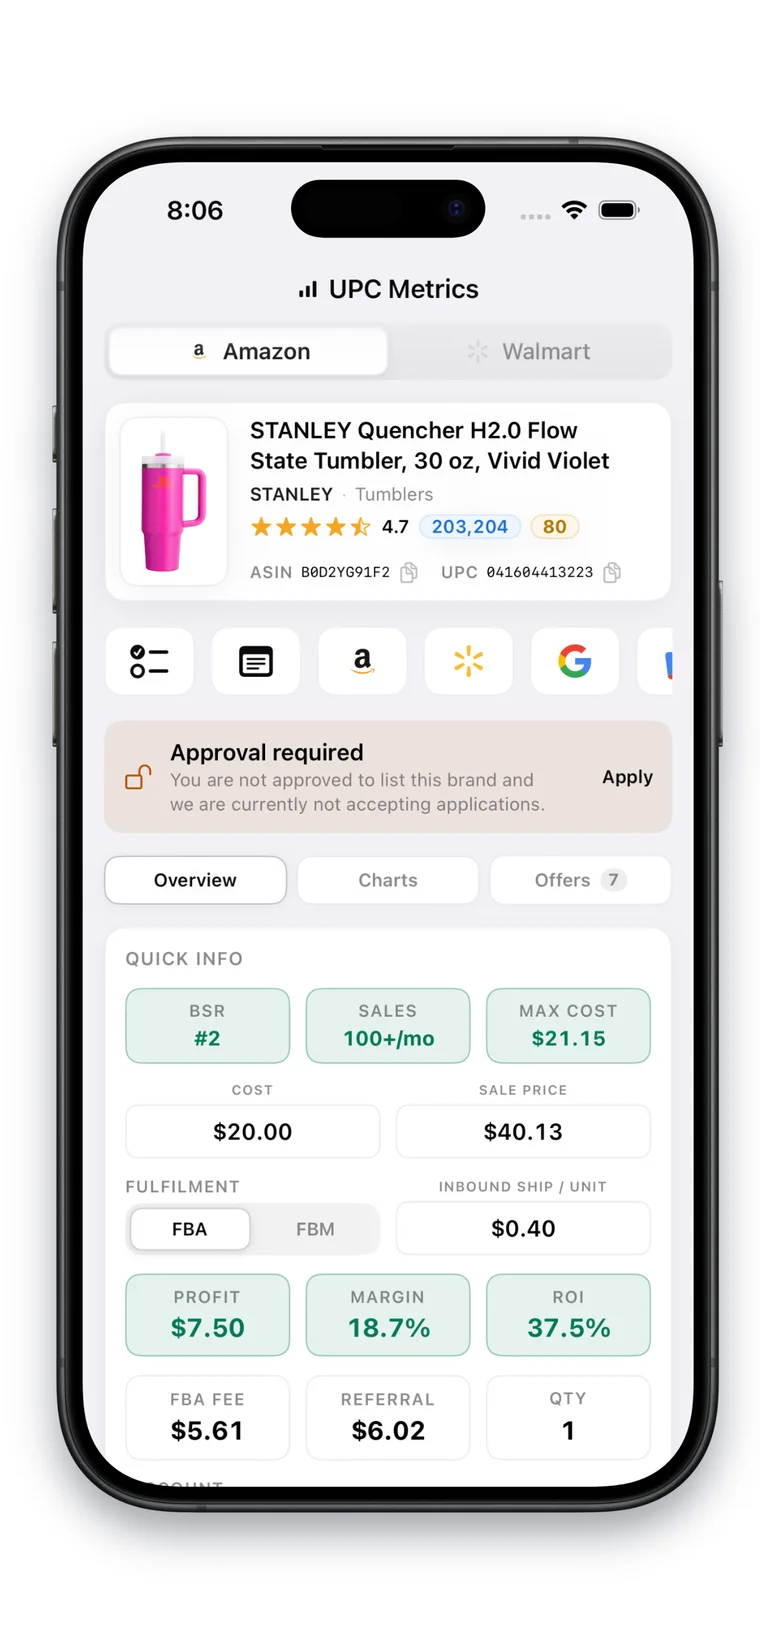
Scan a barcode and read the marketplace-specific verdict before it leaves your hand: Amazon fee detail, BSR and gating, or Walmart demand and labelled estimates.
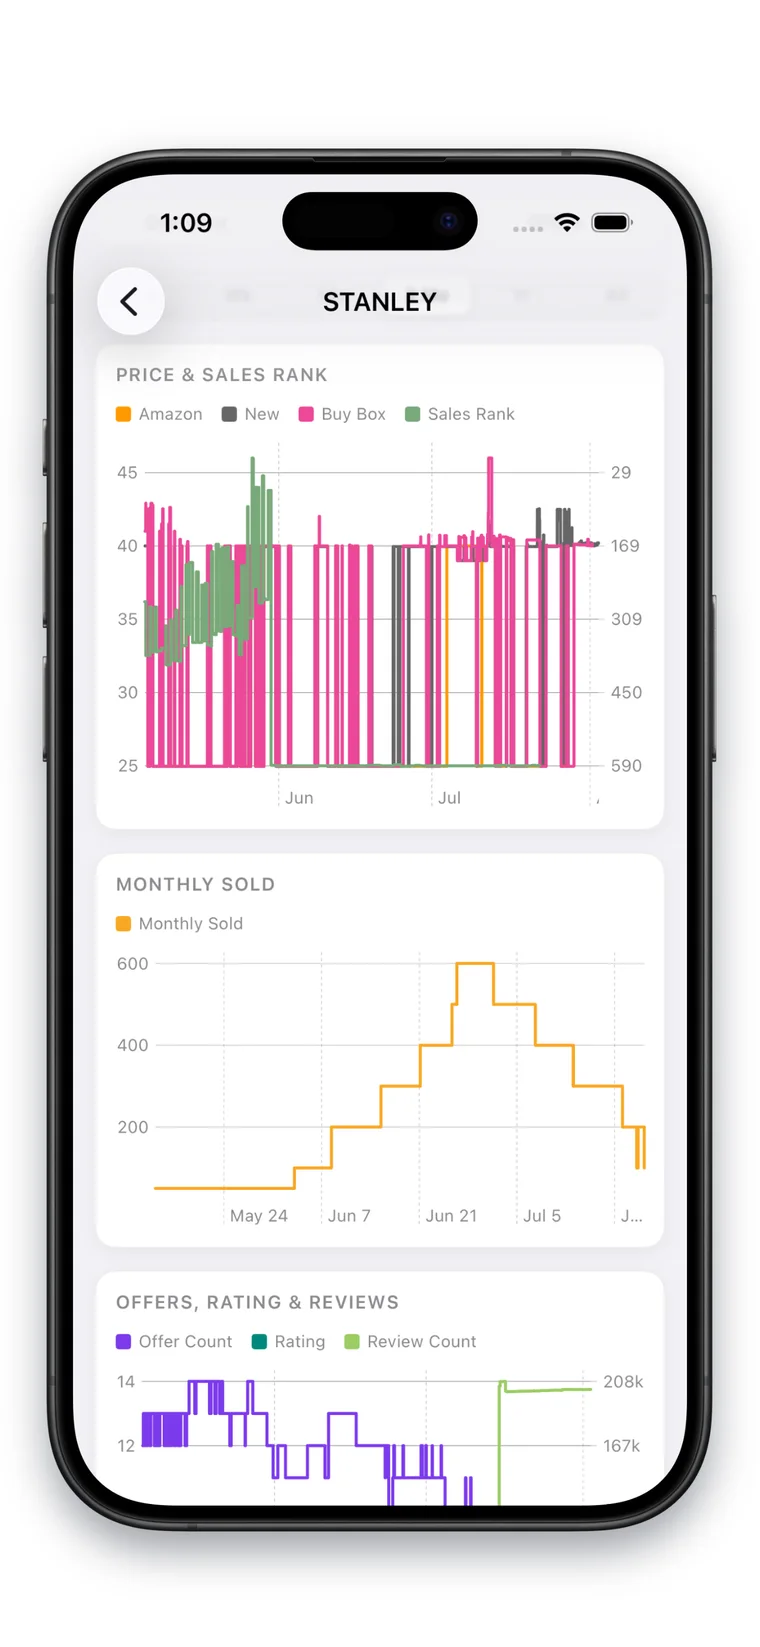
BSR, Buy Box & Price,
In One Scroll.
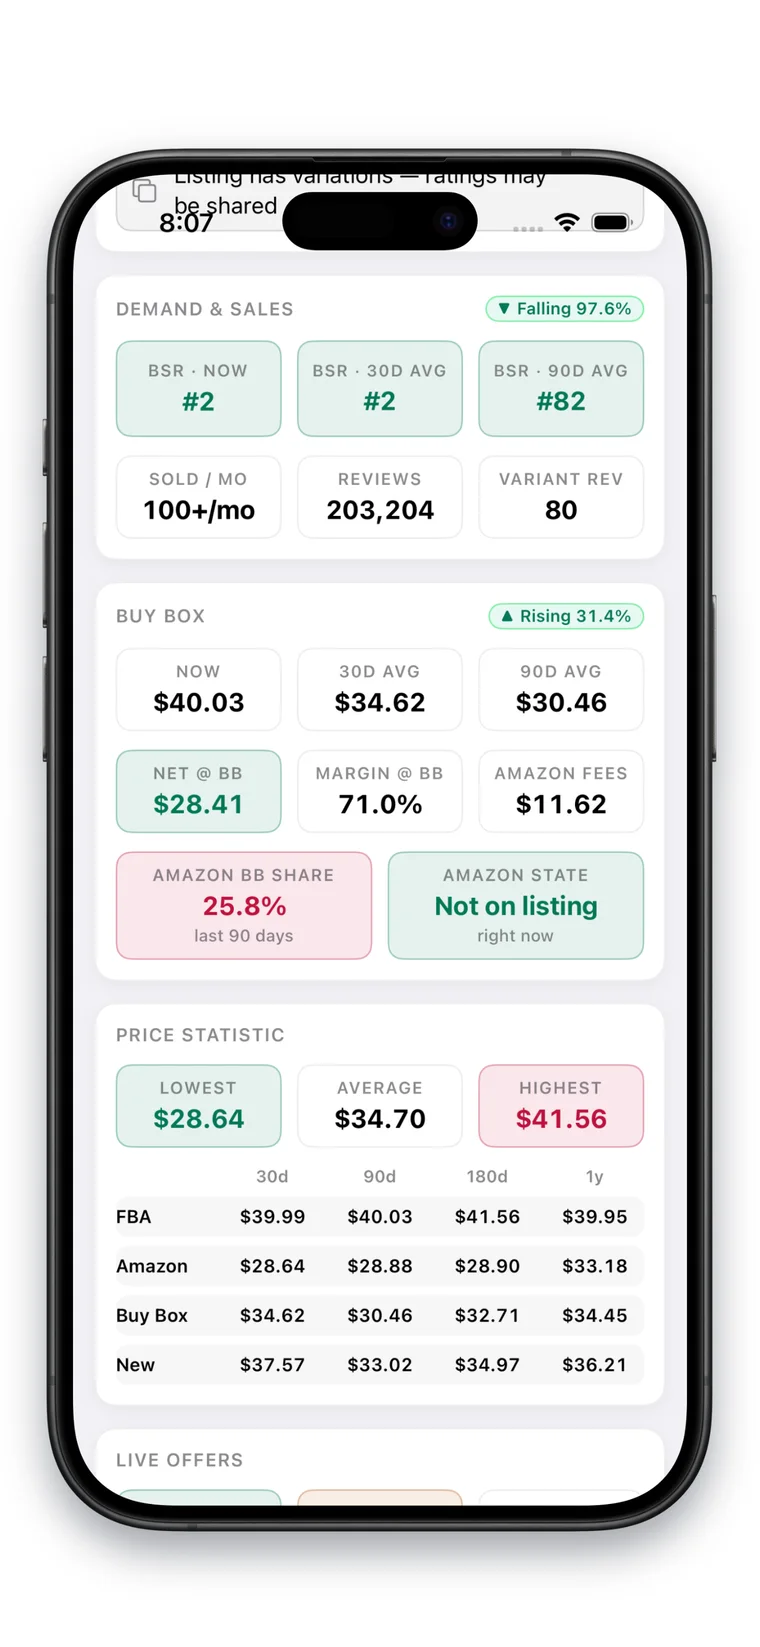
Under the verdict sits the whole listing: current and average BSR with a rank-direction badge, what you would actually net at the Buy Box price, and a price table for every channel from 30 days out to a year.
- Demand & Sales. BSR now, 30-day and 90-day against your thresholds, sold per month, reviews and the variant’s own review count.
- Buy Box Economics. Net and margin at the Buy Box price, with Amazon fees itemized beside them.
- Amazon On The Box. Amazon’s share of the last 90 days, and whether it is on the listing right now.
- Price Statistic. Lowest, average and highest, then FBA, Amazon, Buy Box and New across 30d, 90d, 180d and 1y.
Who You’re
Really Up Against.
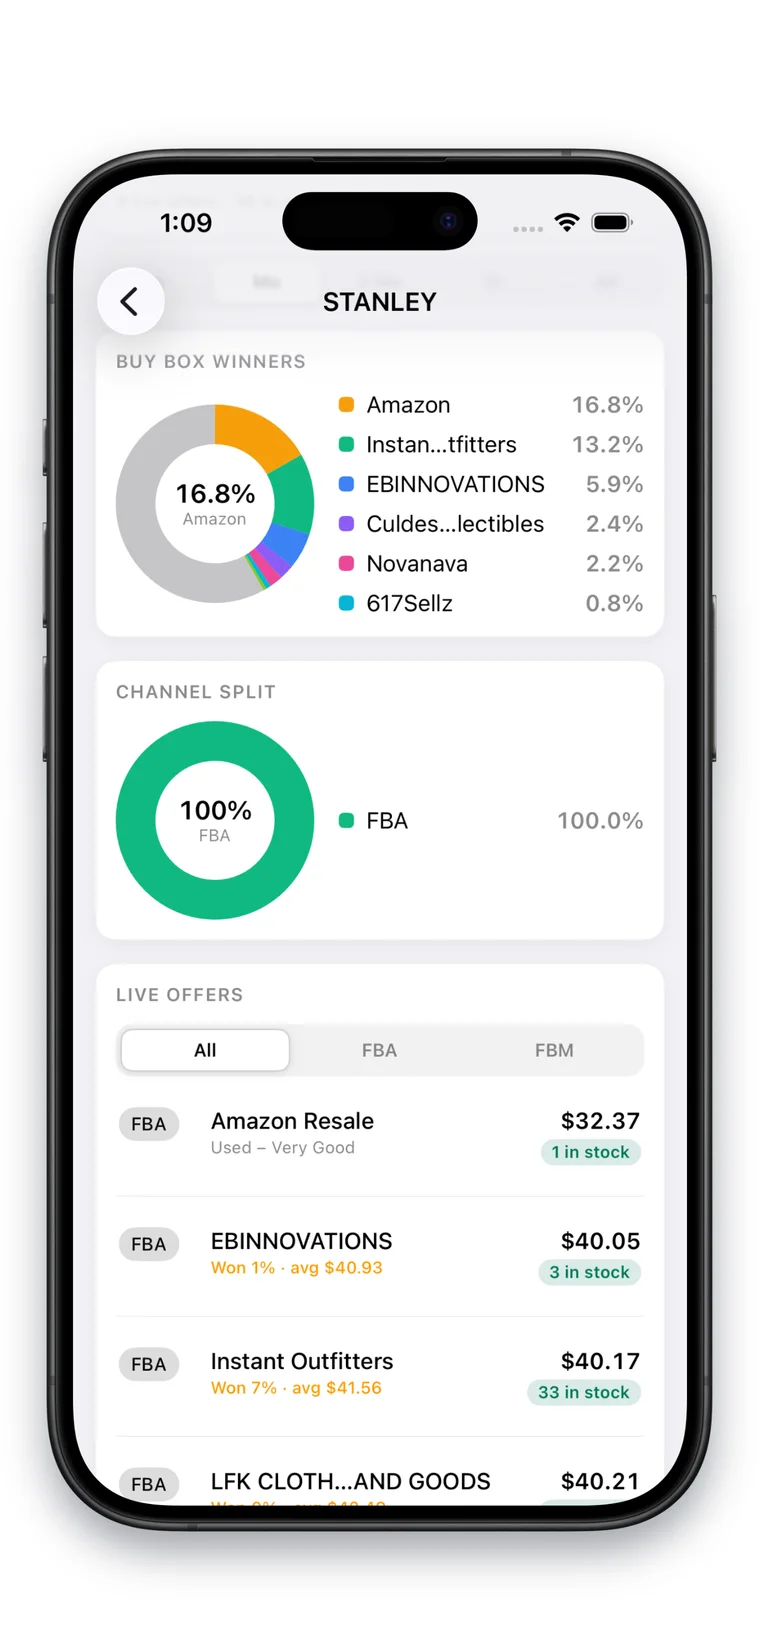
The Buy Box, split by the sellers who actually win it. Every live offer follows underneath with its channel, won share, average winning price and units in stock.
- Buy Box Winners. Each seller’s share of the box over the window, with Amazon called out on its own.
- Channel Split. How much of the Buy Box sits on FBA against FBM.
- Live Offers. Every seller with price, condition, won percent and stock on hand.
- Filter By Channel. One tap between all offers, FBA only and FBM only.
The Listing’s Identity,
Down To The Codes.
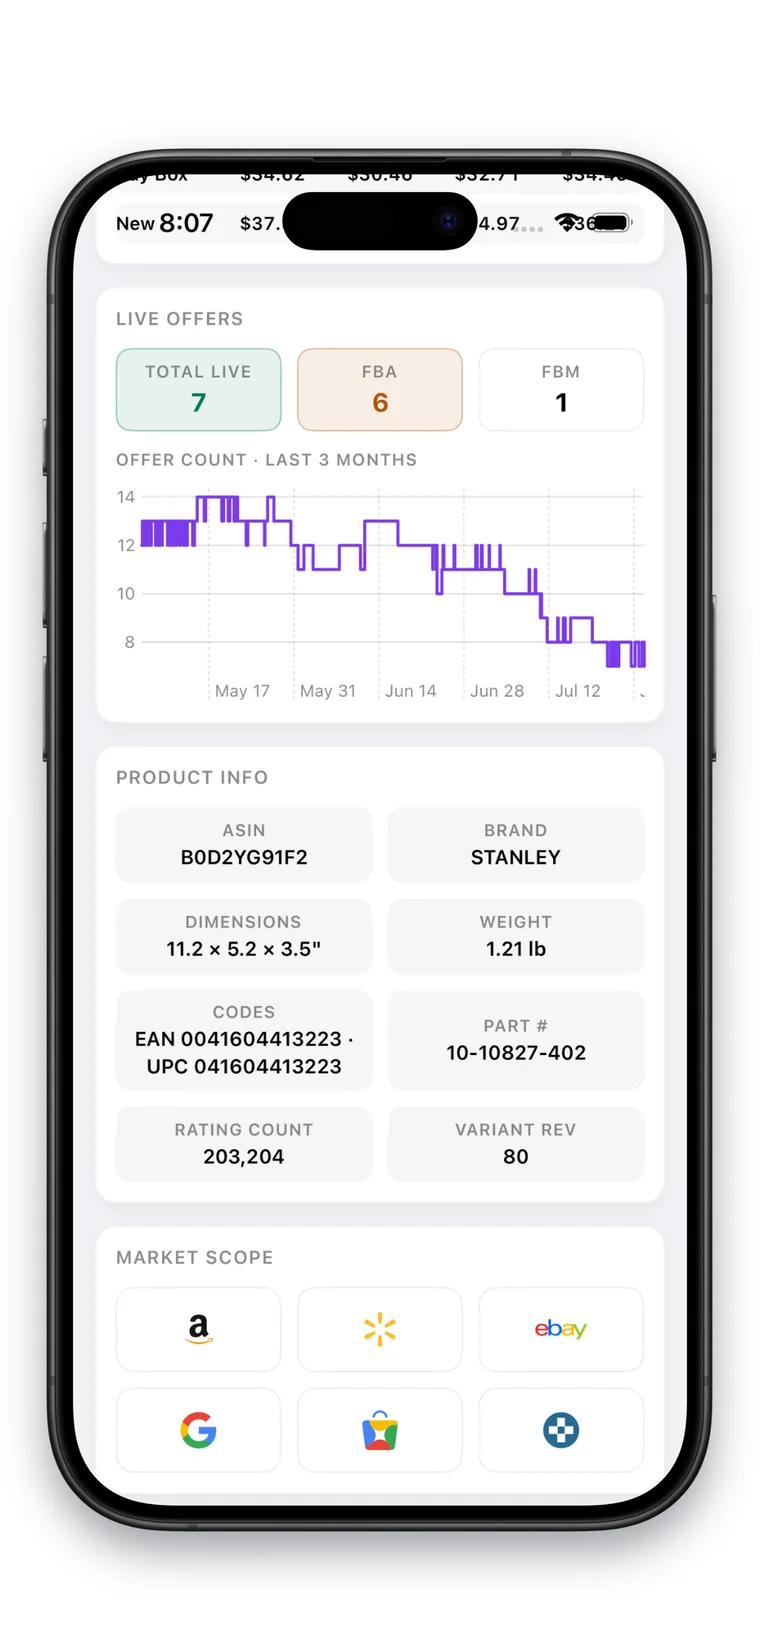
Offer count over three months so a crowding listing shows itself, the full product record from dimensions to part number, and one-tap market scope to check the same item everywhere else.
- Offer-Count Trend. Total, FBA and FBM live now, charted over the last three months.
- Product Info. ASIN, brand, dimensions, weight, EAN and UPC, part number and rating count.
- Variant Reviews. The variant’s own review count beside the listing’s shared total.
- Market Scope. Jump to the same product on Amazon, Walmart, eBay and Google.
Flip The Toggle,
Scan Walmart.
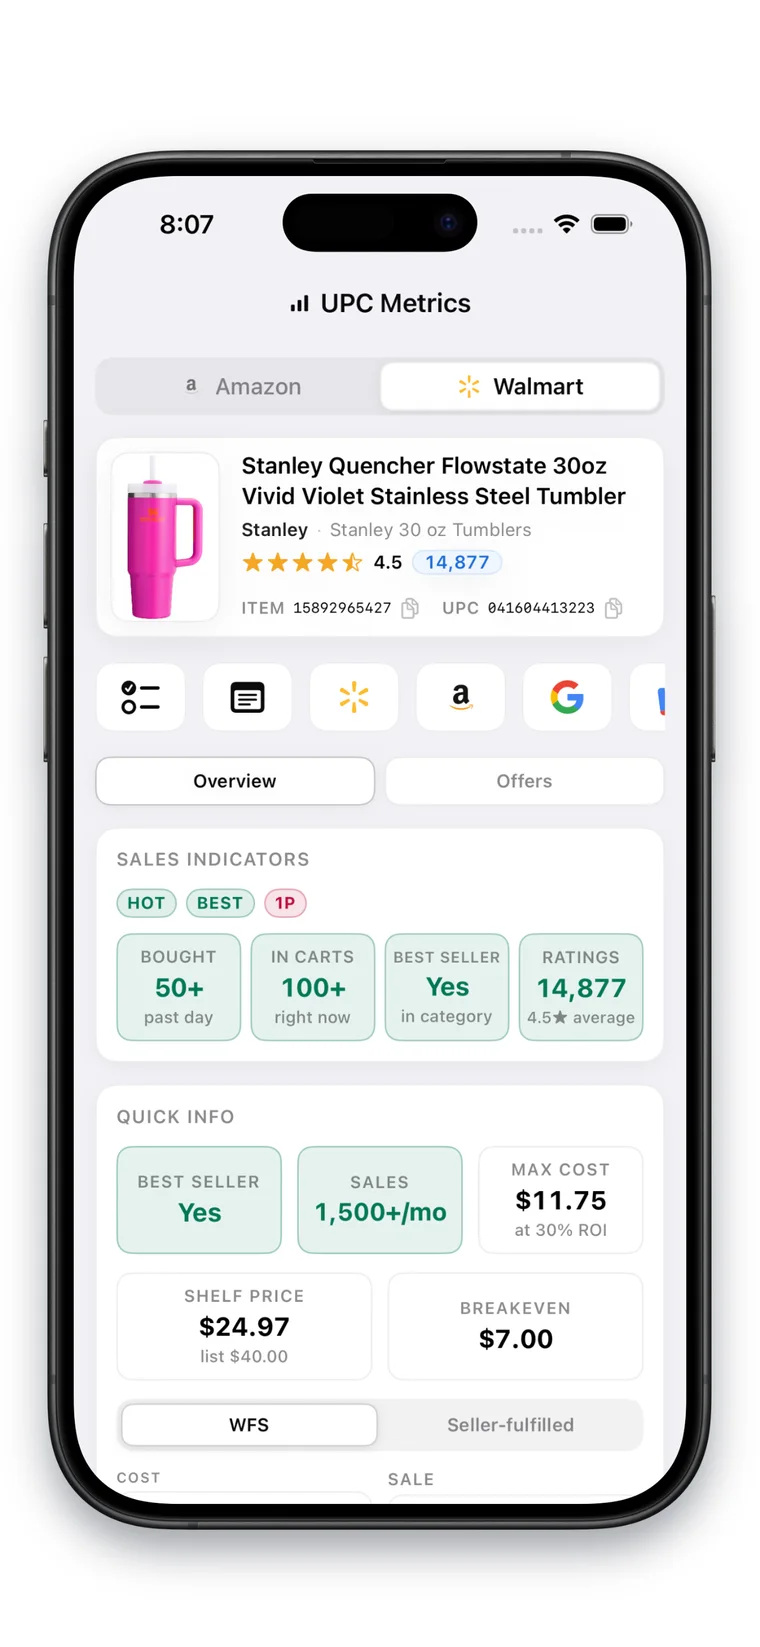
The same scan against Walmart: published demand signals like bought-past-day and in-carts, shelf price against list, and a breakeven and max cost at your target ROI — with estimates labelled as estimates.
- Sales Indicators. Bought past day, in carts right now, category best-seller status and ratings.
- Hot, Best & 1P Flags. Walmart’s own badges, plus a flag when Walmart itself is on the listing.
- Quick Info. Max cost at your target ROI, shelf price against list price and the breakeven.
- WFS Or Seller-Fulfilled. Toggle fulfillment and the estimate re-runs.
Your Real P&L,
On Amazon And Walmart.
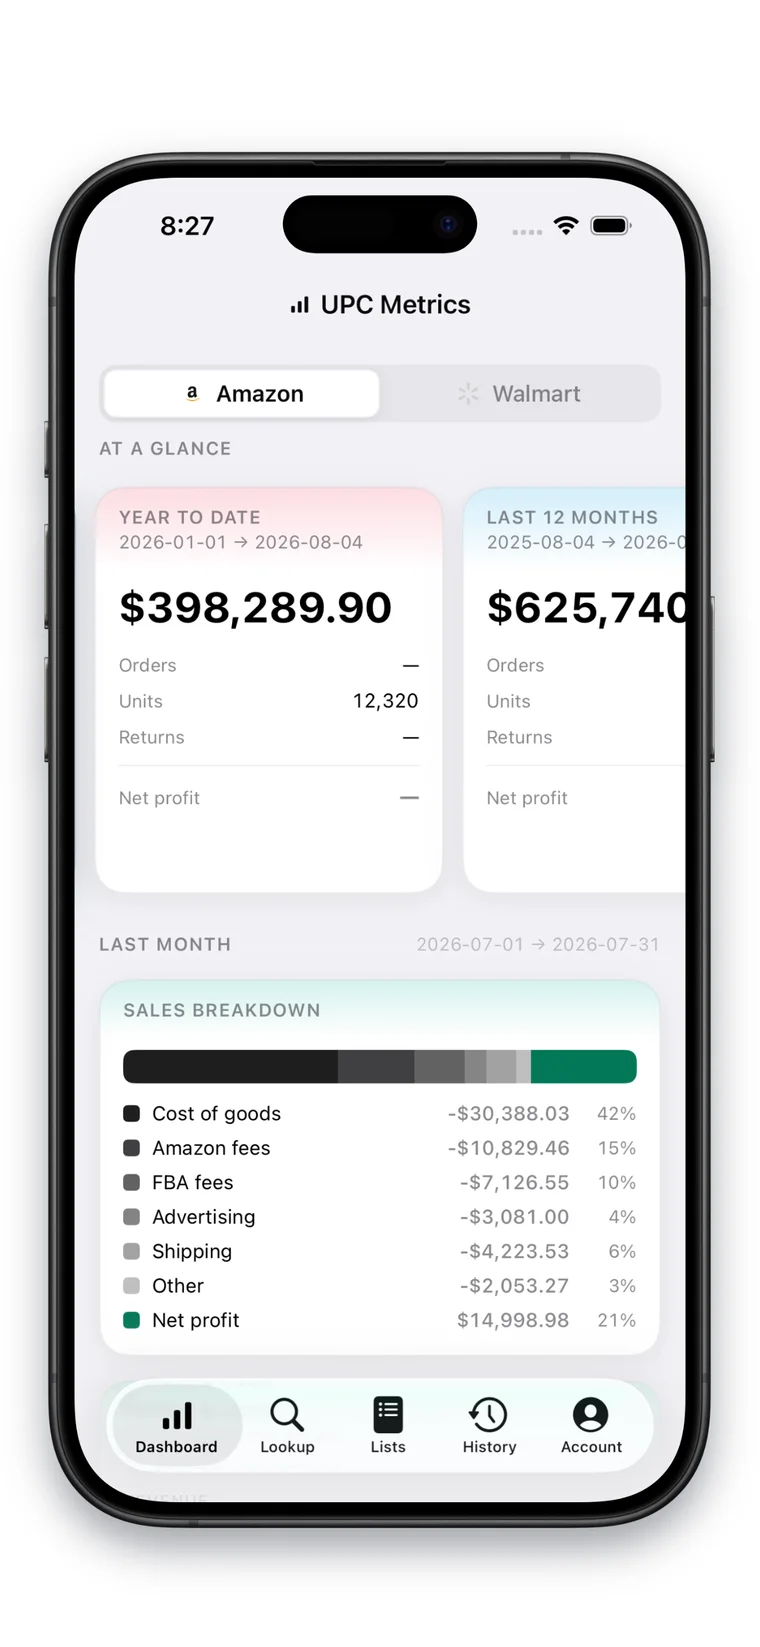
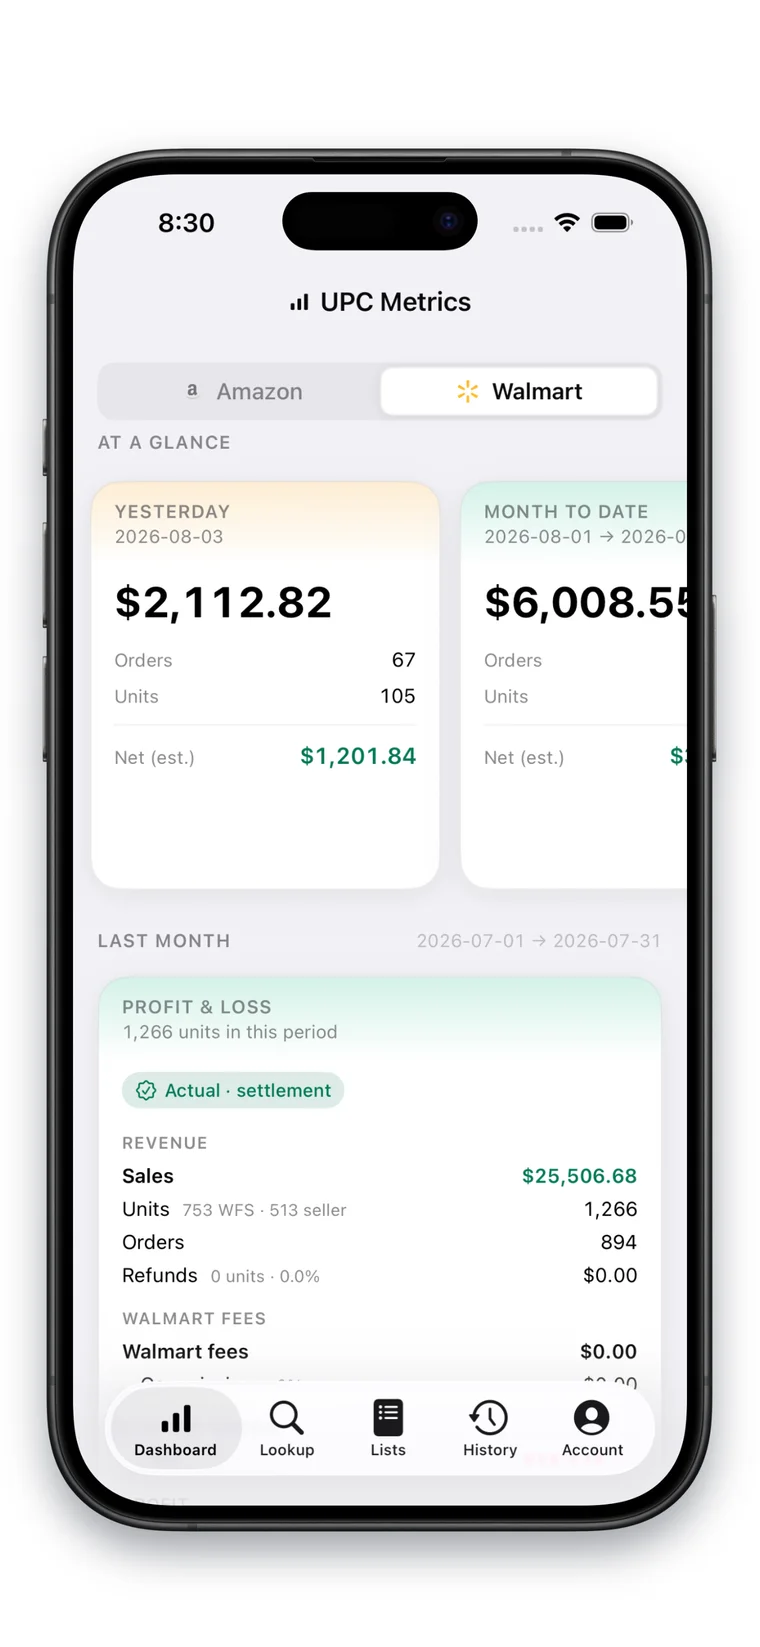
Connect your Amazon seller account, your Walmart seller account, or both — and the dashboard turns into actual settlement numbers for each marketplace: yesterday, month to date and last month, from revenue through every fee line down to net.
- Two Full P&Ls. A complete Amazon P&L and a complete Walmart P&L, each built from its own marketplace’s data — one toggle flips the whole dashboard between them.
- Actual, Not Modelled. Last month’s P&L is built from settlement data and labelled that way.
- At A Glance. Yesterday and month-to-date cards with orders, units and estimated net.
- Full Breakdown. Sales, units by fulfillment, orders and refunds, then fees down to net.
Beyond The Product Screen.
Three more things the app does that never sit still long enough for a screenshot.
A Real Camera Scanner
UPC, EAN and ISBN straight off the shelf, with a torch toggle for dim aisles and manual entry when a label is too worn to read.
Gating, Answered
Every Amazon product runs a real eligibility check against your own Seller Central — eligible, approval required or restricted — with a one-tap apply when approval is needed.
Synced Lists & History
Save a product to a colored list or reopen a past lookup and it is the same record the Chrome extension and the web app see. Build a sourcing list on the shelf, find it on your desk.
Never Buy A Dud. Scan It First.
Profit, ROI, demand and gating on every product, before it leaves the shelf. 14-day free trial, cancel any time.