One Product. Both Marketplaces.
Cross-Checked At Once.
One panel reads the same product on Amazon and Walmart — one UPC, both sets of fees, profit and demand, without switching tabs or tools. See which marketplace actually pays before you buy.
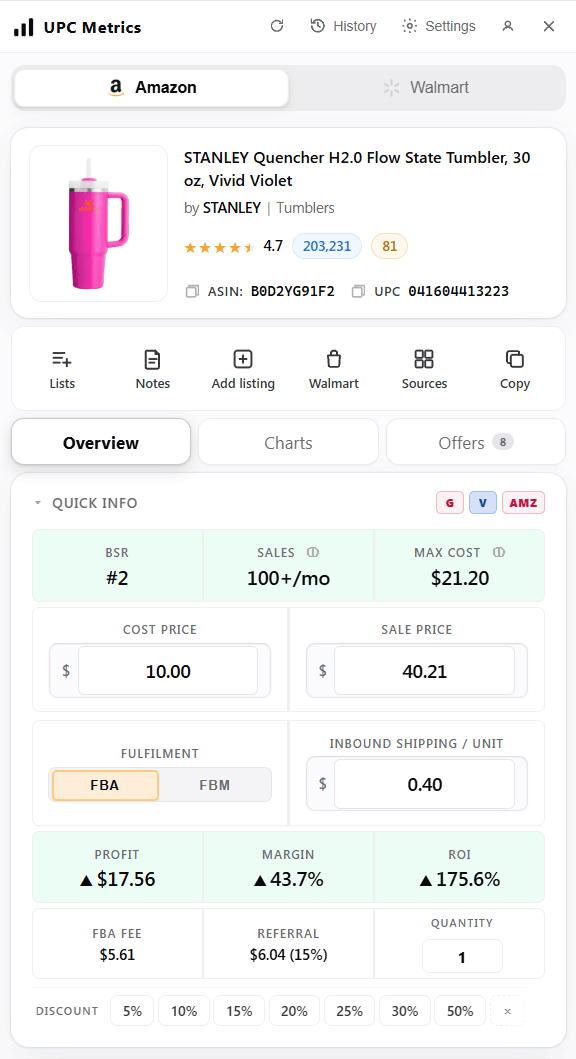
The Amazon Panel, Opened Up.
Every card the extension docks beside an Amazon listing, laid out one by one. Same Stanley tumbler, same live data — this is what loads before the page finishes scrolling.
Type A Cost.
Read The Verdict.
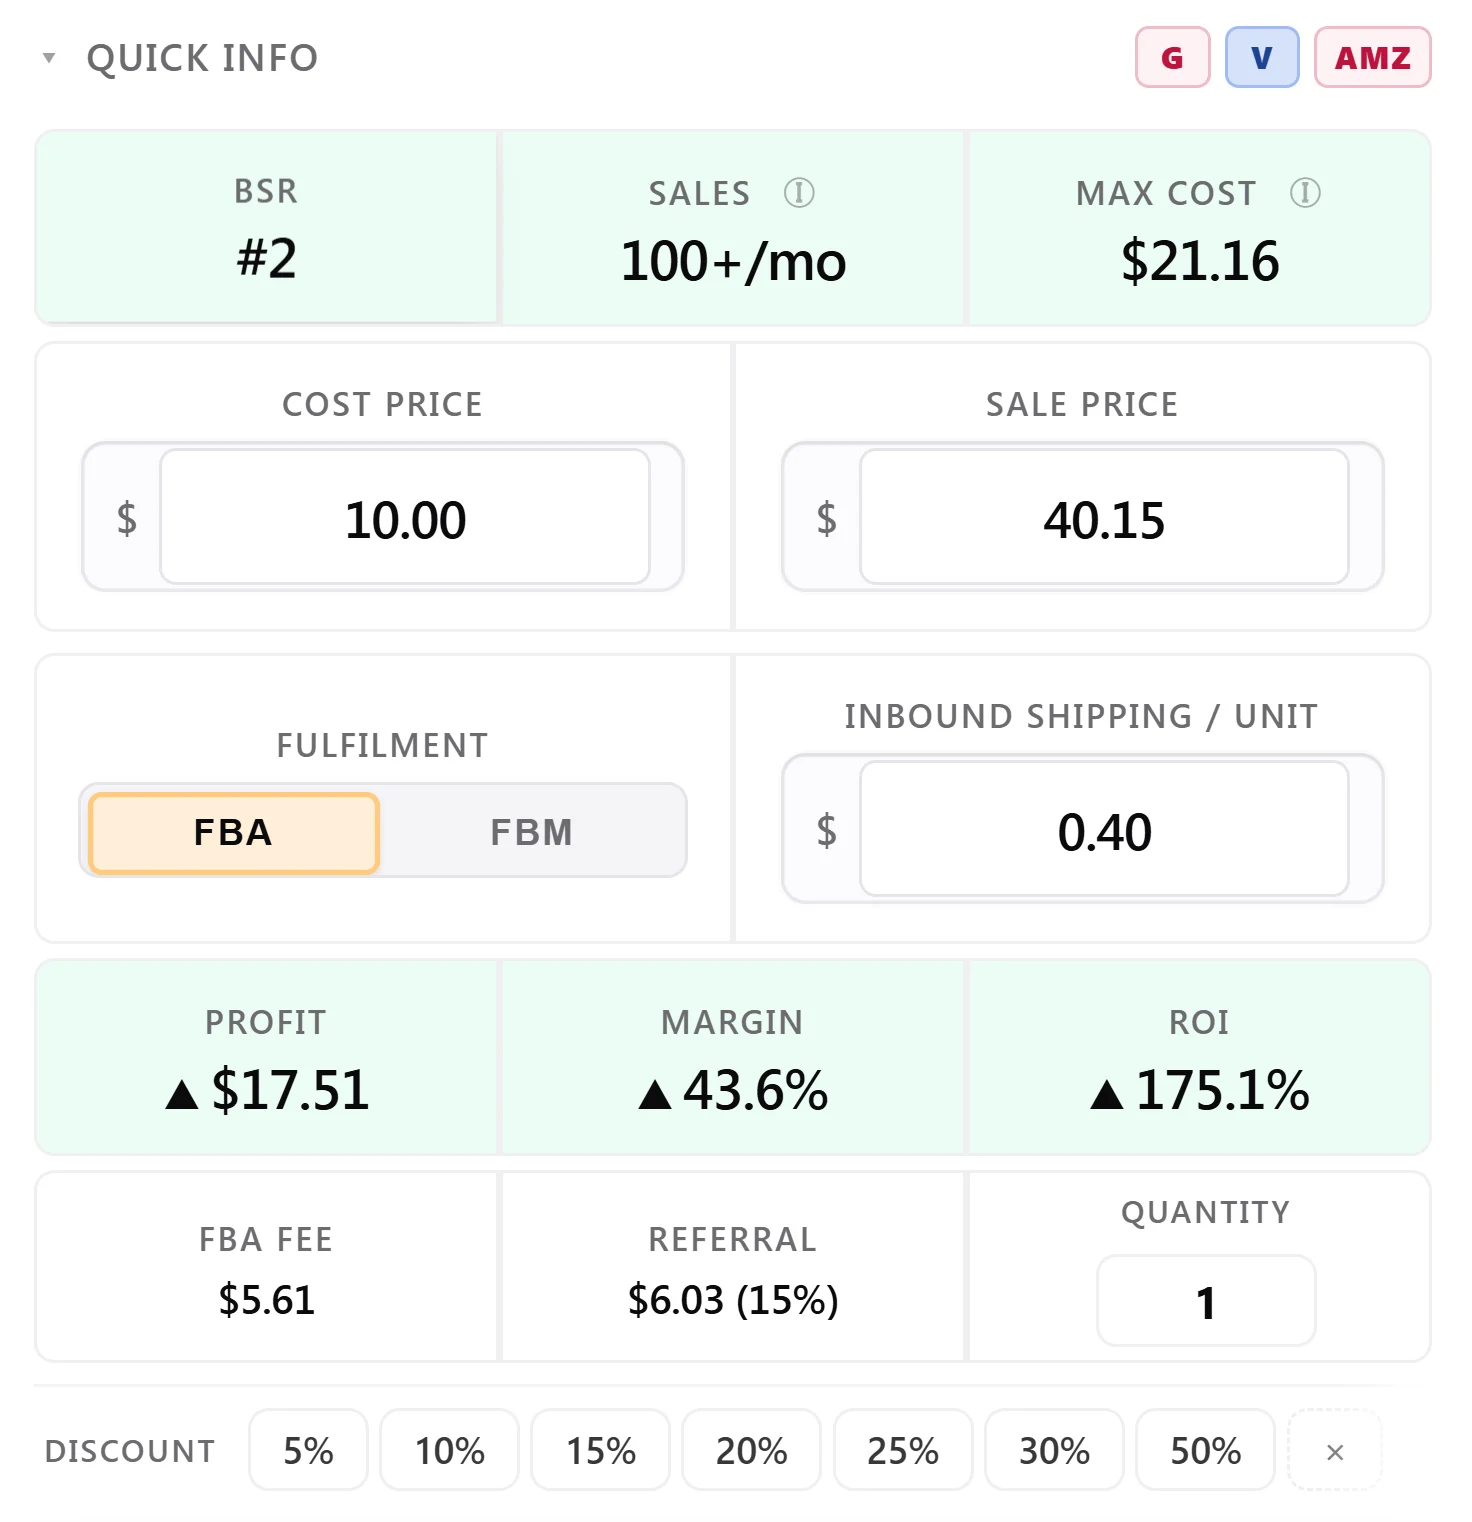
Quick Info opens the panel: BSR, estimated sales and your max cost up top, then cost and sale price against the real fee model, with profit, margin and ROI recomputed as you type.
- Real Fee Math. The category referral fee and the FBA fee, itemized under the result, with an FBA / FBM toggle.
- Max Cost. The most you can pay and still clear your target ROI, computed before you type anything.
- The Whole Deal. Inbound shipping per unit and quantity fold straight into the math.
- Discount Chips. Supplier discounts from 5% to 50%, applied to your cost in one tap.
The Listing’s Past,
On The Listing.
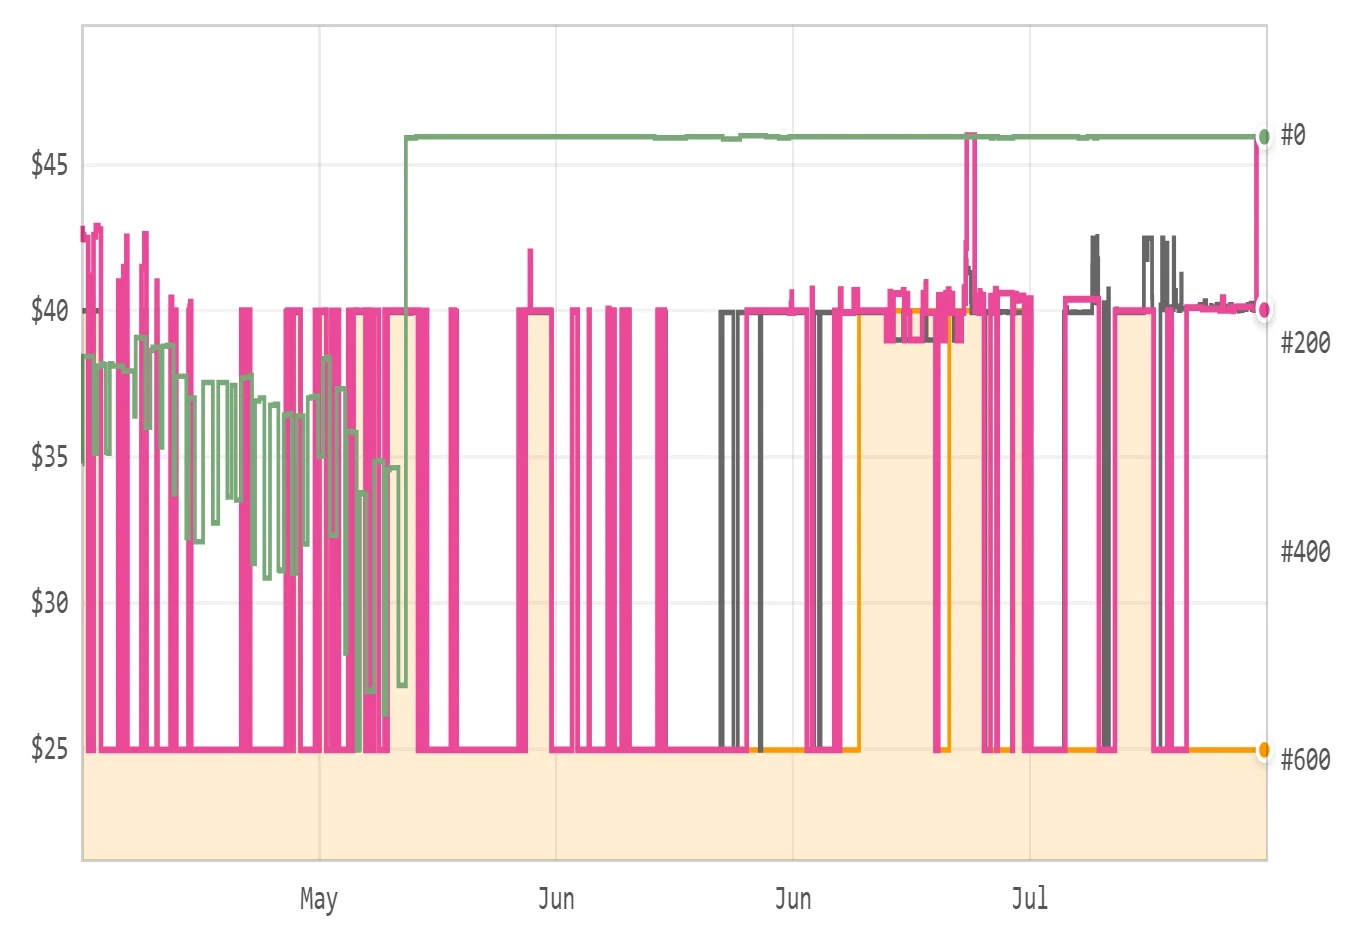
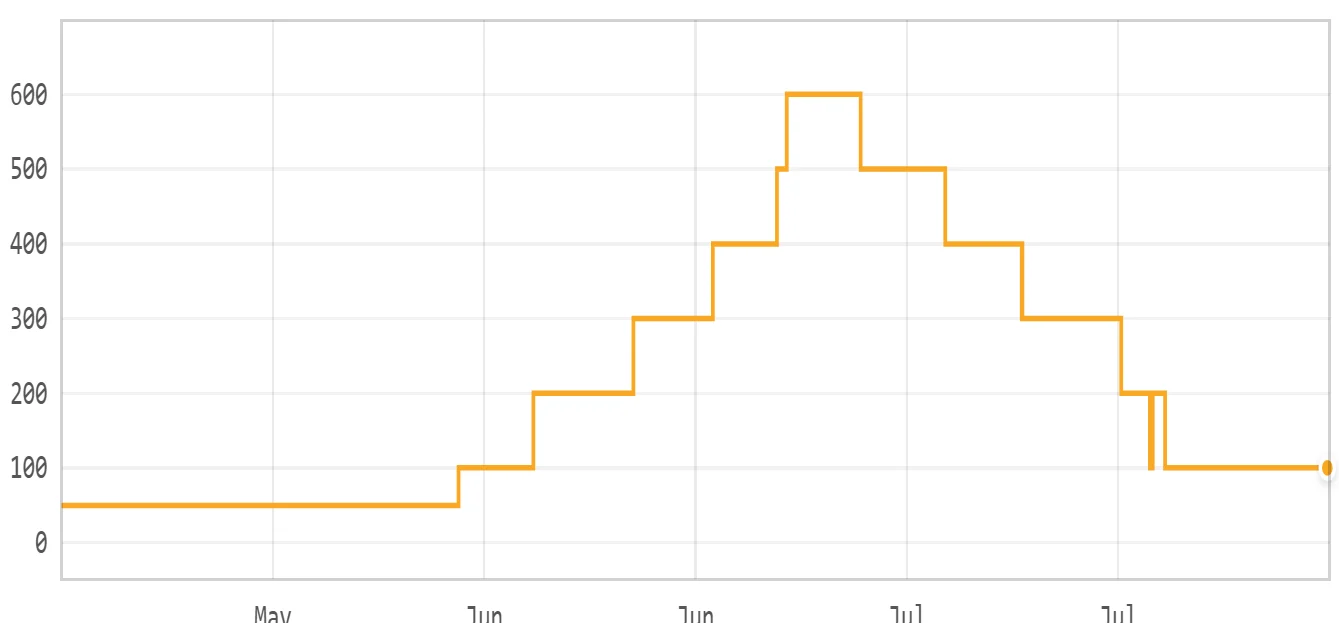
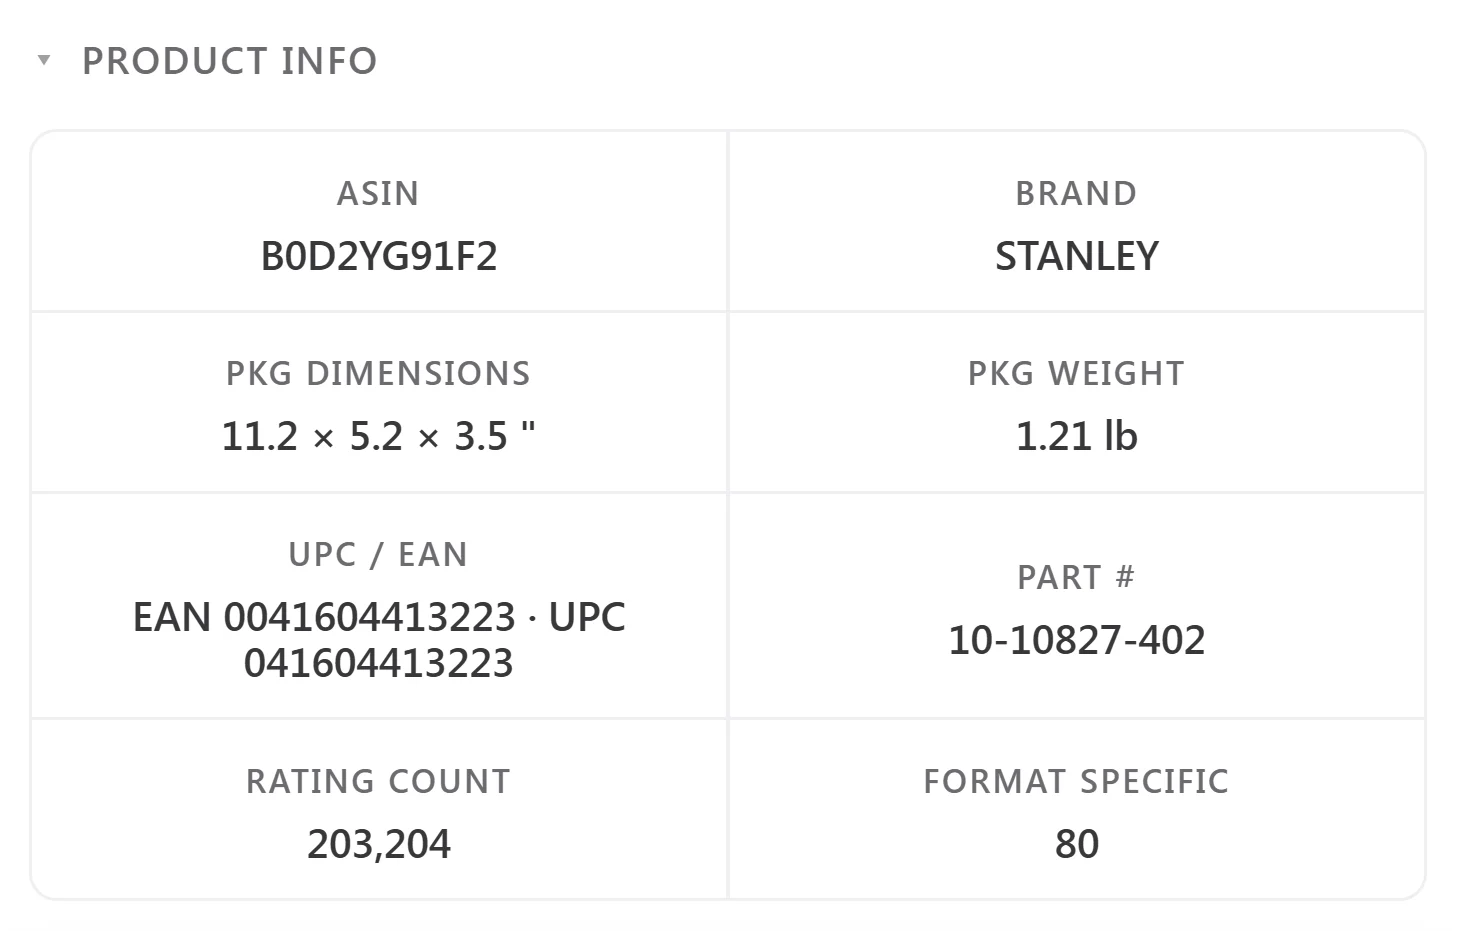
Keepa-style history without leaving the product page: price across channels stepped against the sales-rank line, and the monthly-sold signal charted underneath.
- Price Against Rank. Amazon, New and Buy Box price overlaid on sales rank, on one dual axis.
- Monthly Sold. Amazon’s own sold-per-month signal, charted as it moves.
- Any Window. Day, week, month, three months, a year, or the full history.
And The Rest Of The Amazon Read.
The Product, Resolved
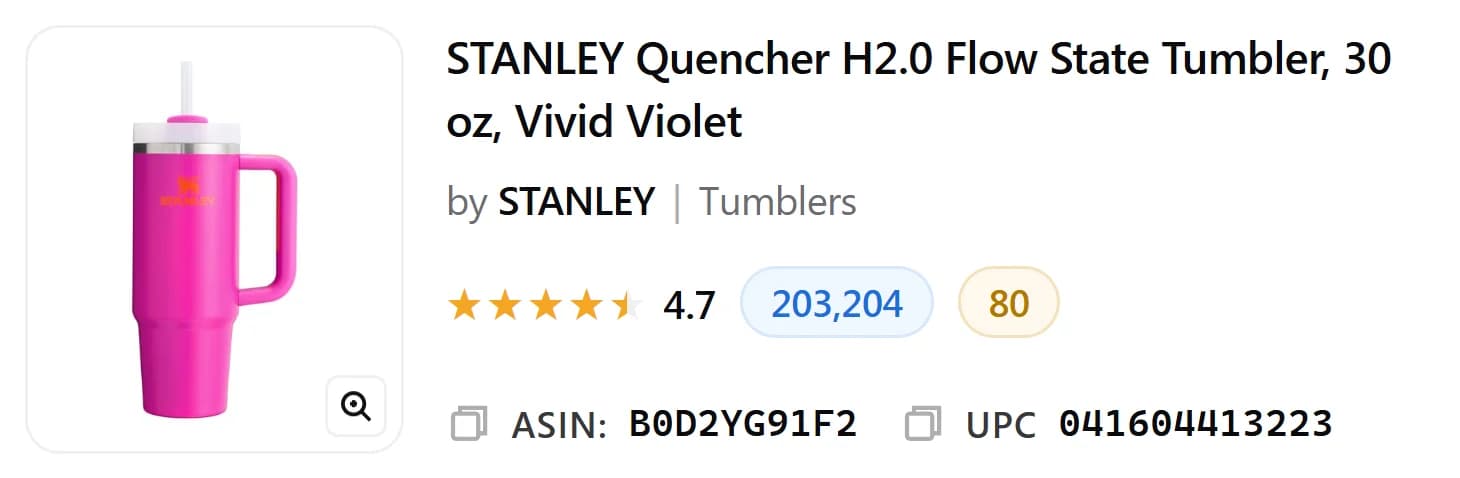
Title, brand, category, rating and review count, with the ASIN and UPC one copy-tap away.
Sales Rank
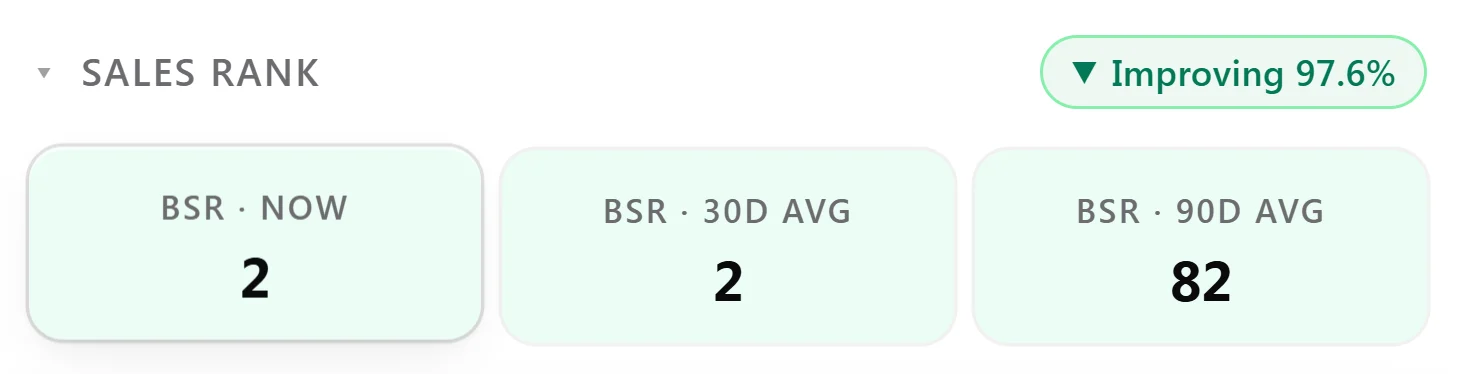
BSR now against the 30- and 90-day average, with a direction badge when demand builds or fades.
Buy Box
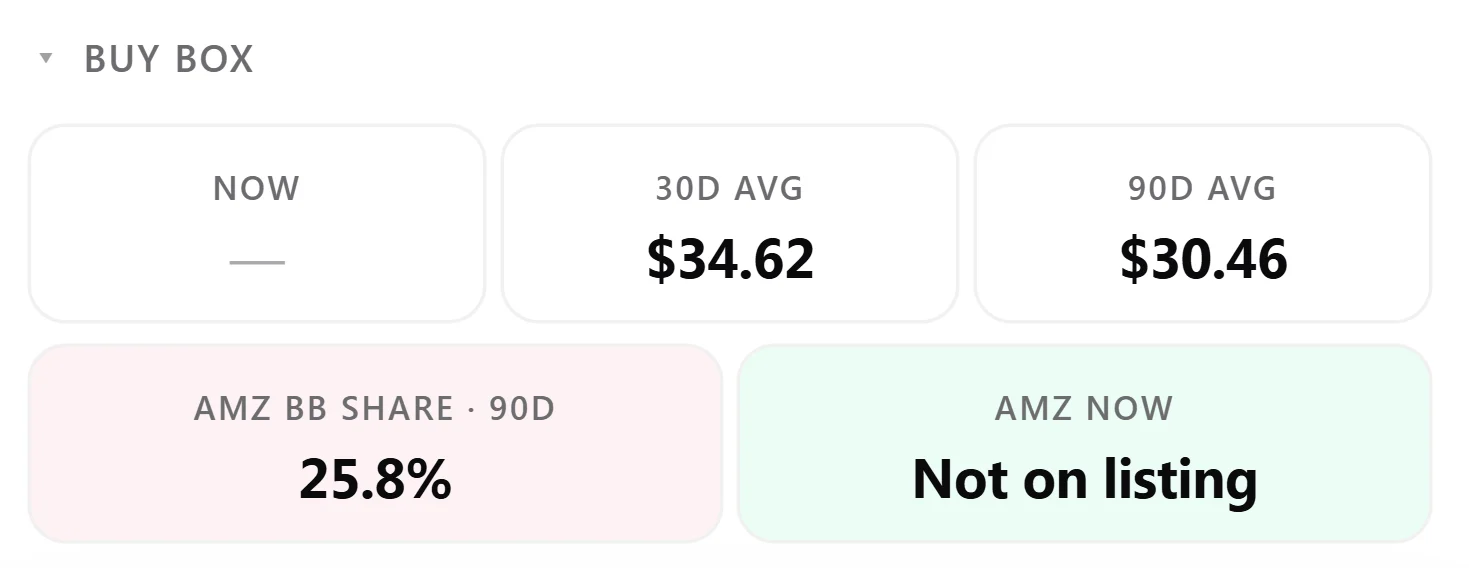
The box now and on average, Amazon’s own 90-day share, and whether Amazon is on the listing right now.
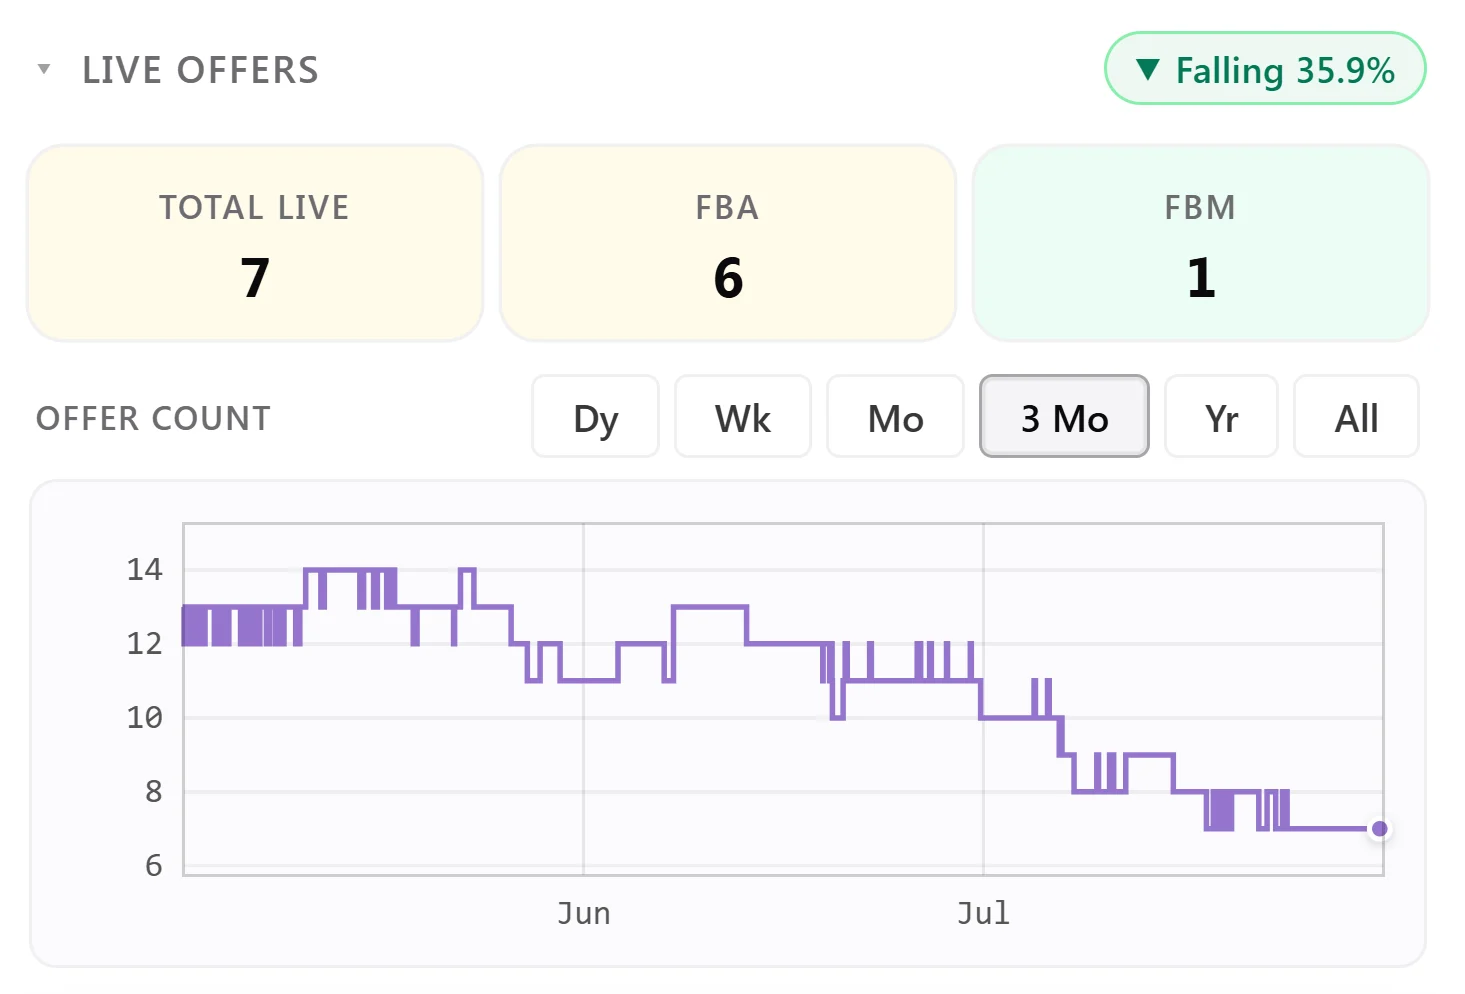
Live Offers
Total, FBA and FBM sellers live now, with the offer count charted from a day out to the full history.
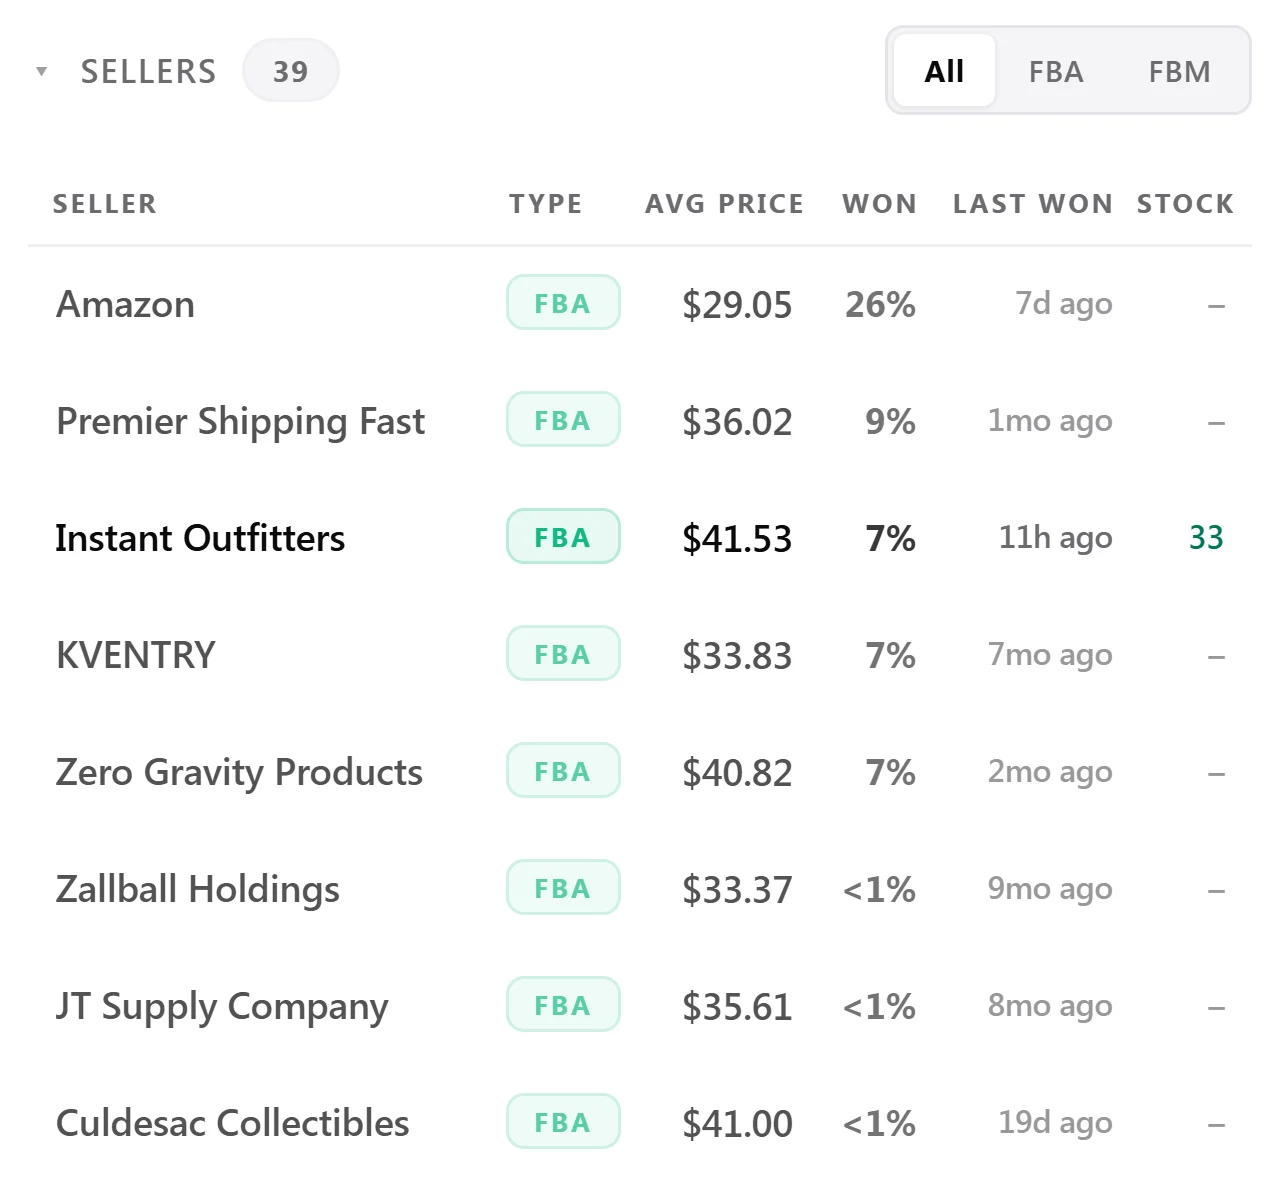
Sellers
All 39 sellers with type, average price, win share, last win and stock depth, filterable to FBA or FBM.
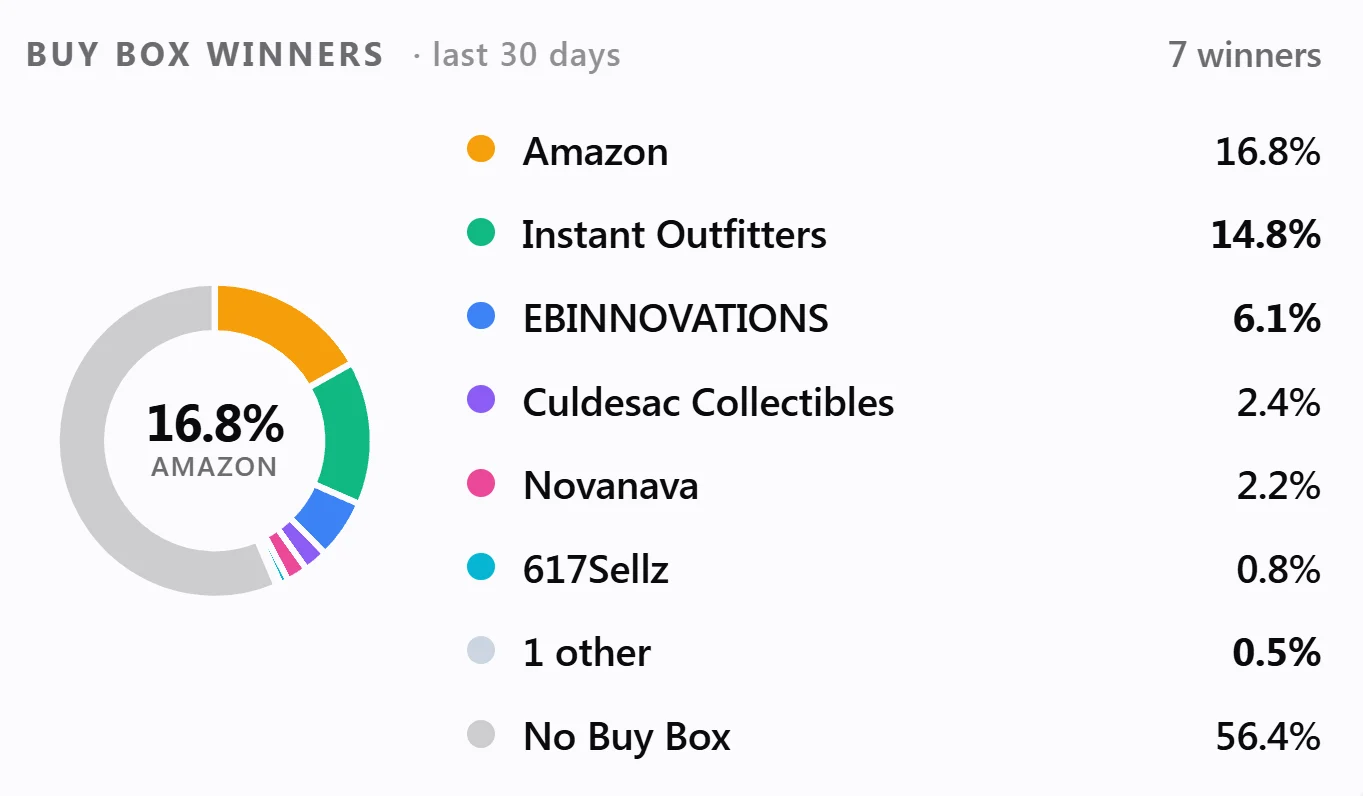
Buy Box Winners
Every winner of the last 30 days with their share — including the 56% of the time no one held it.
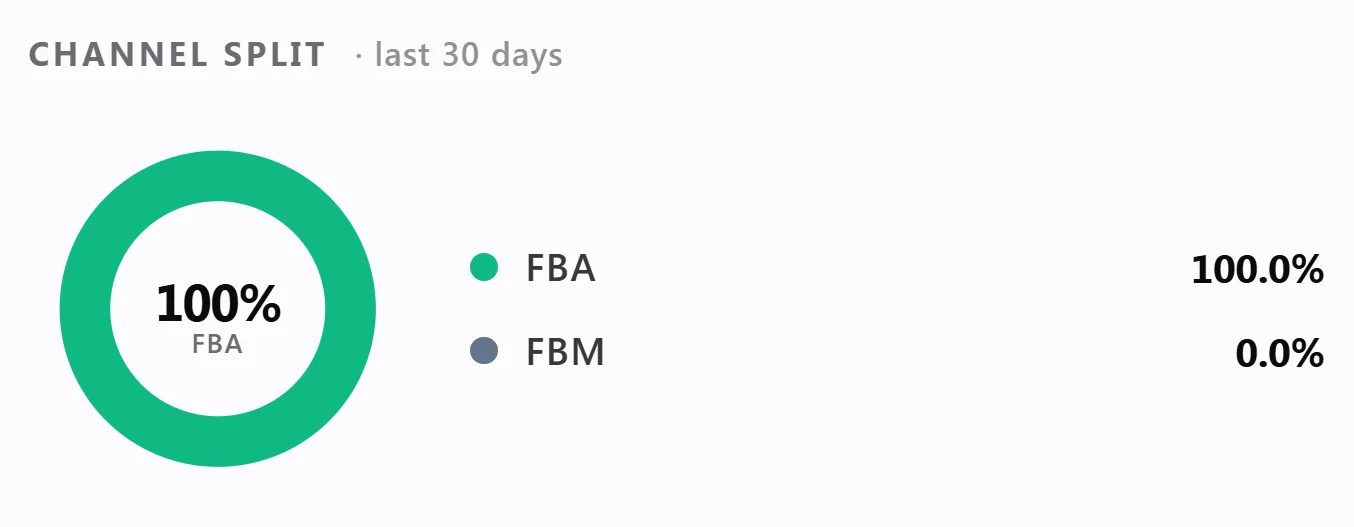
Channel Split
How much of the Buy Box sat on FBA against FBM over the window.
Offers, Rating & Reviews
Competition and social proof on one chart — offer count against rating and review count over time.
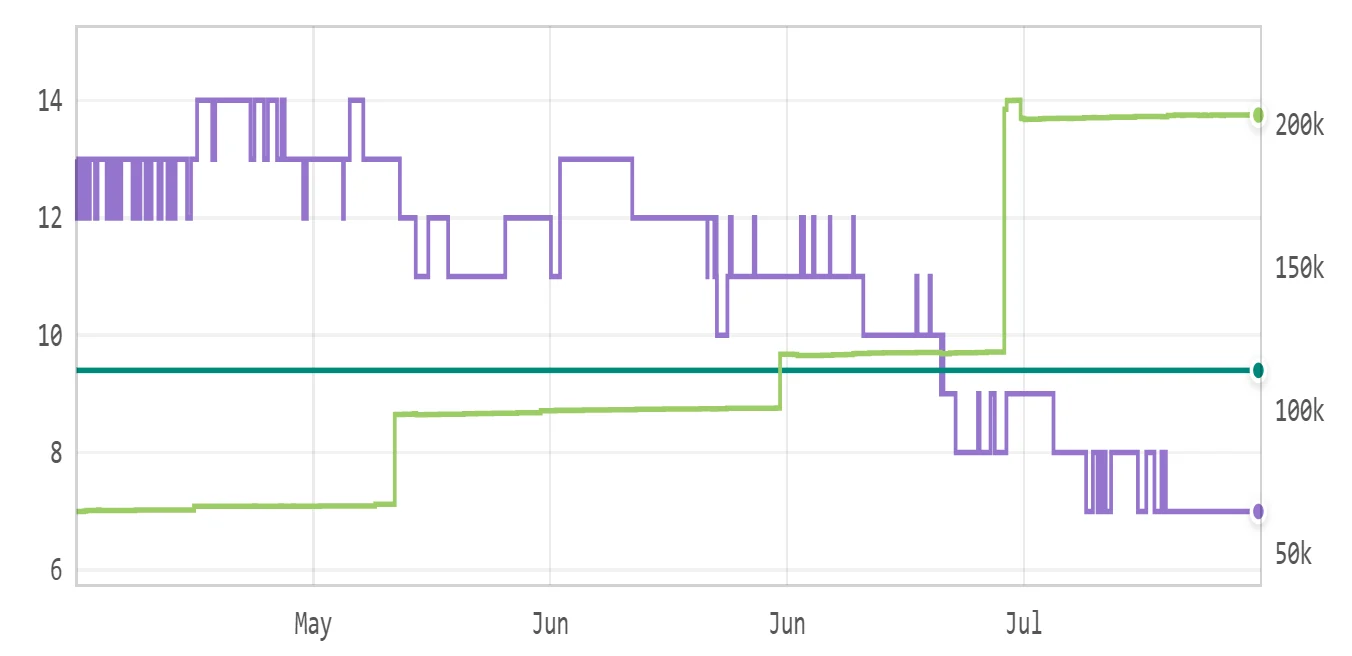
ASIN Statistic
Lowest, average and highest, then FBA, Amazon, Buy Box and New across 30 days to a year.
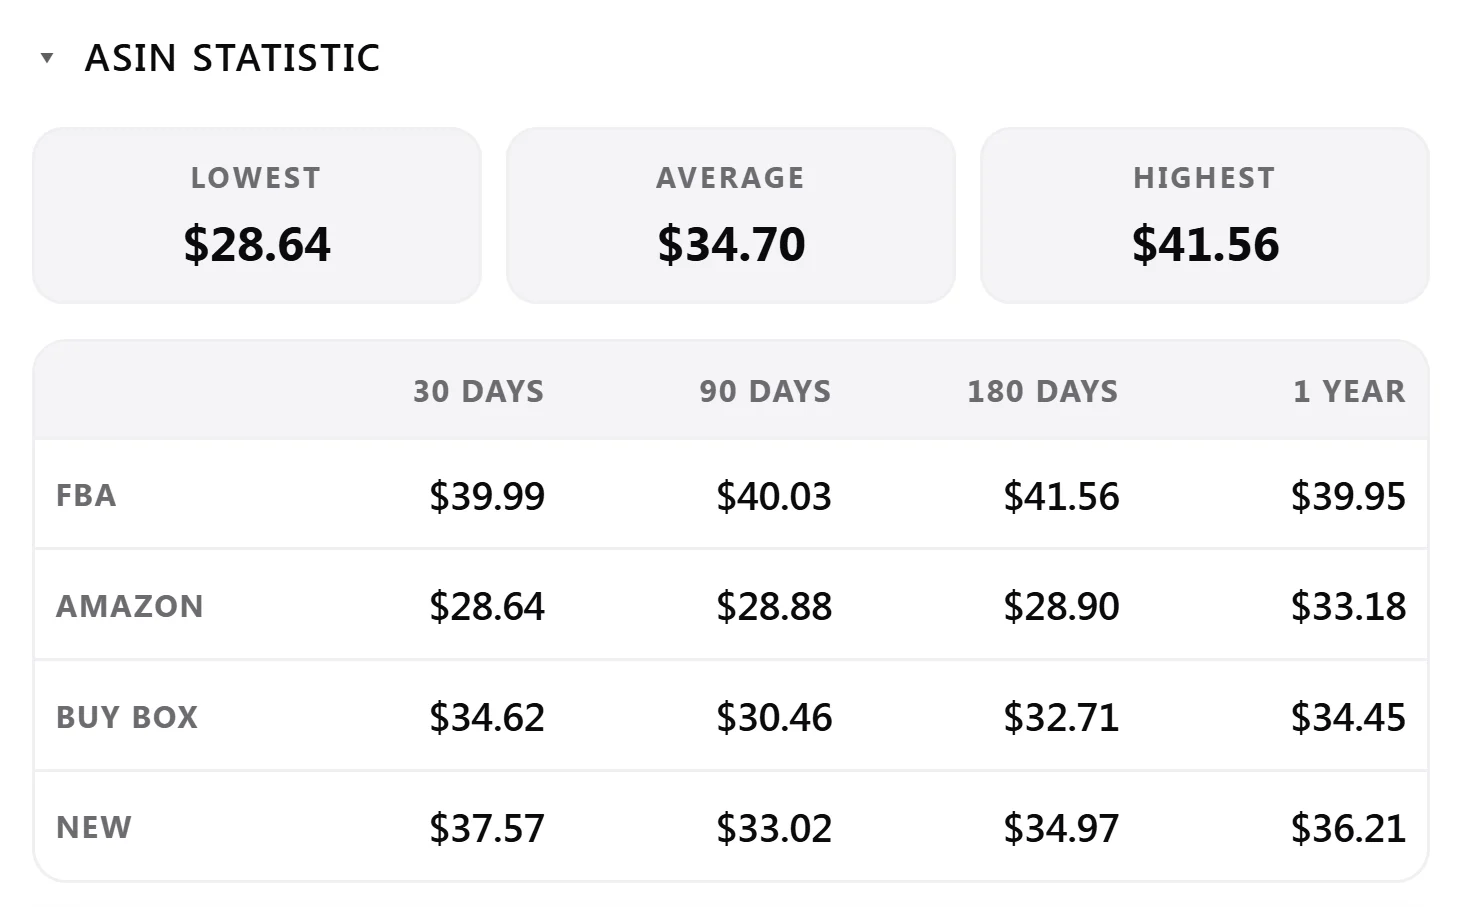
Product Info
Package dimensions, weight, EAN and UPC, part number and the variant’s own review count.
The Walmart Panel, Honestly Labelled.
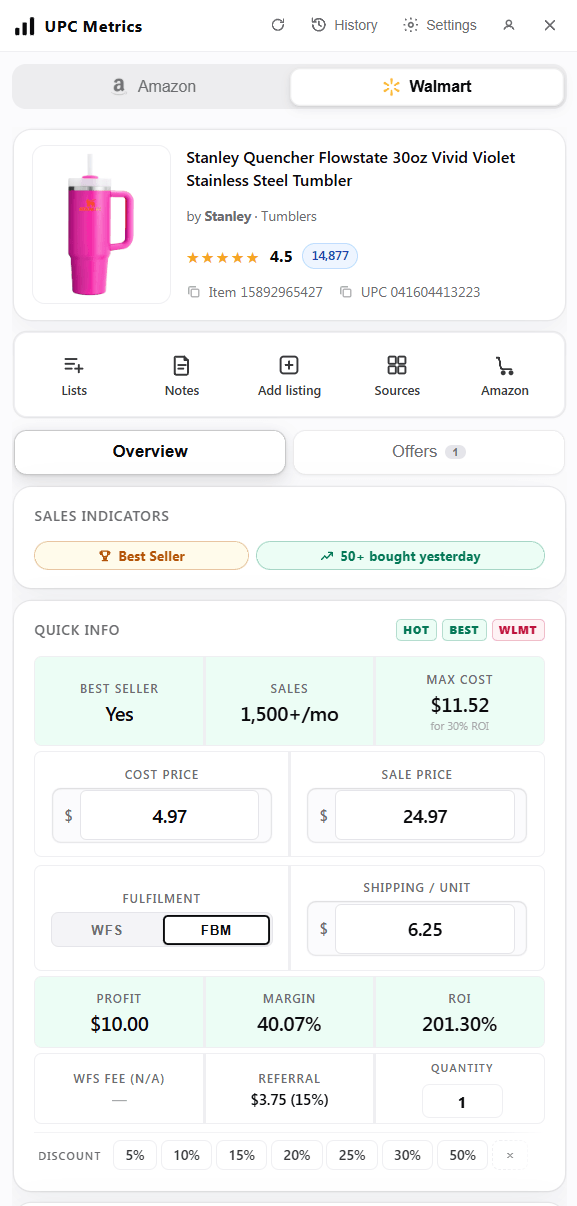
Flip to walmart.com and the same panel docks beside the item: Walmart's published demand signals read as confirmed floors, fees estimated and labelled, and a seller list with the stock depth Walmart doesn't surface.
The Same Math,
On Walmart Fees.
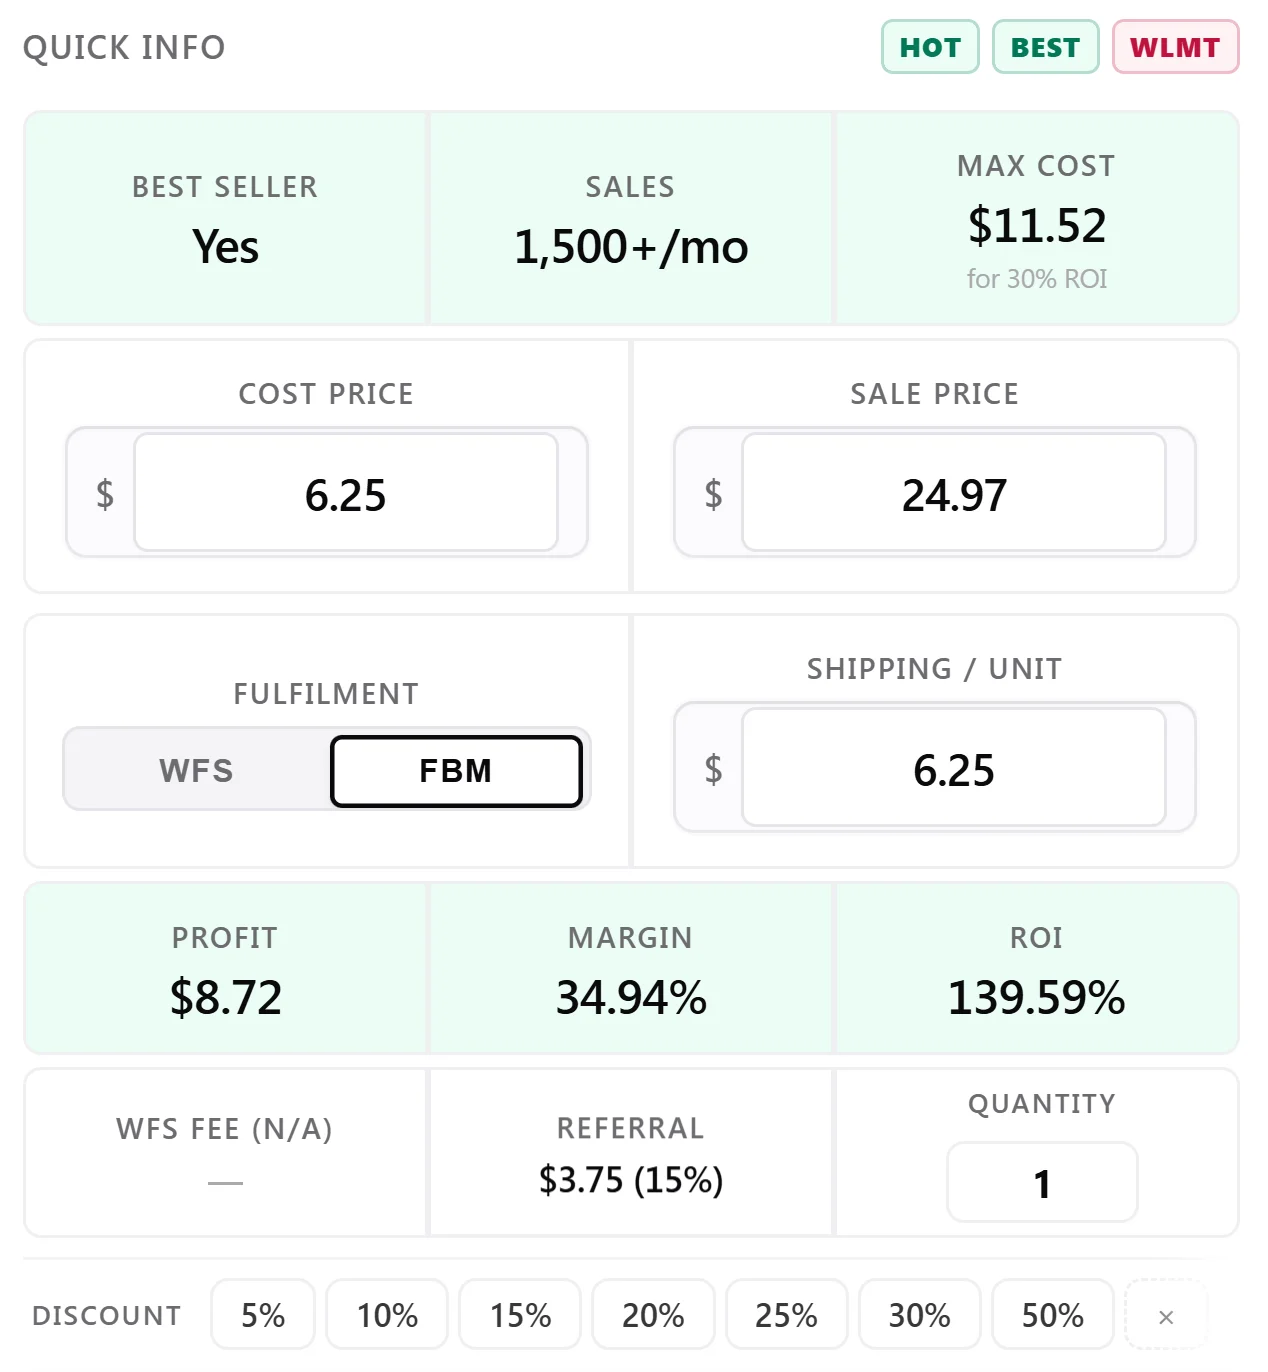
Cost and sale price against Walmart's referral rate, with a WFS estimate when it applies — profit, margin, ROI and the max cost that still clears your target.
- Max Cost At Your ROI. The ceiling on what you can pay, computed for your own target.
- WFS Or Seller-Fulfilled. Toggle fulfillment and the fee line re-runs; estimates stay labelled.
- Hot, Best & WLMT Flags. Walmart’s own badges beside the numbers, plus a flag when Walmart itself sells it.
- Discount Chips. The same 5% to 50% supplier discounts, one tap.
Demand You Can
Actually Confirm.
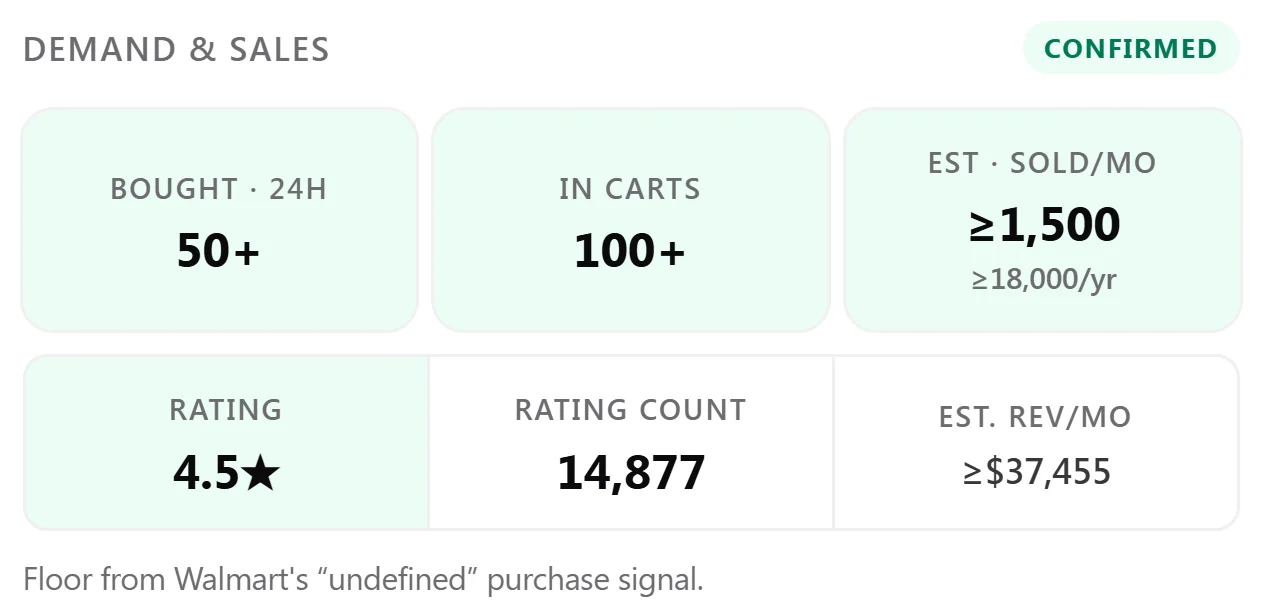
Walmart publishes real purchase signals — bought in the last 24 hours, carts right now, best-seller status. The panel reads them as confirmed floors and derives the estimate from there.
- Confirmed, Not Guessed. Bought-24h and in-carts come straight off the listing.
- A Floor, Not A Wish. Estimated sold per month is at least the published signal — ≥1,500 stays ≥1,500.
- Revenue Floor. The same floor priced out per month at the current sale price.

And The Rest Of The Walmart Read.
The Item, Resolved
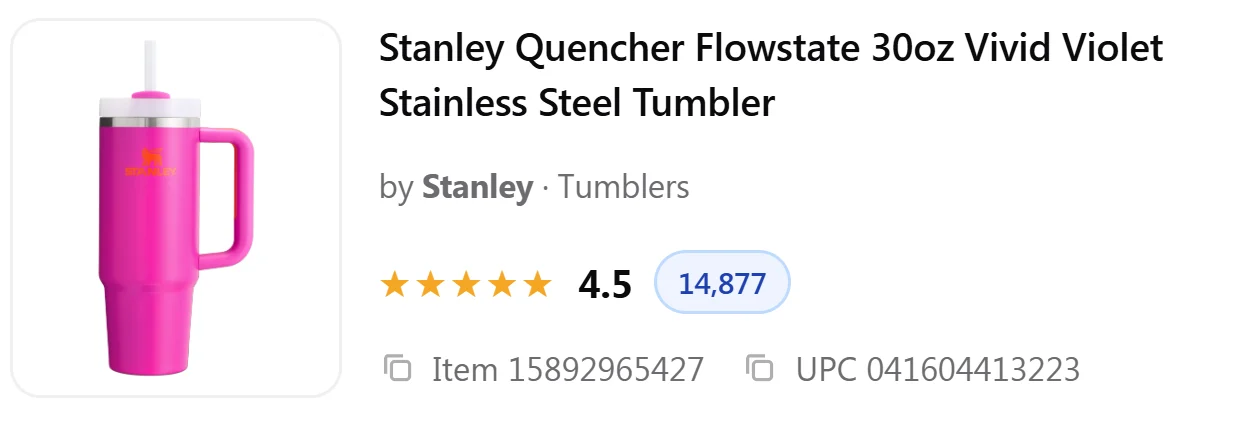
Title, brand, rating and review count, with the item ID and UPC one copy-tap away.
Live Offers
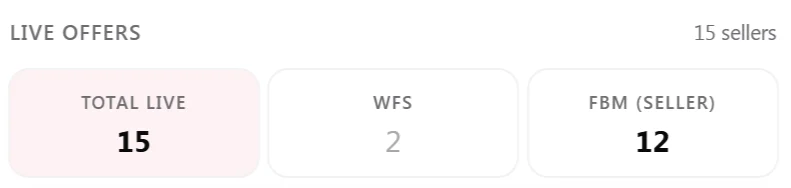
Total live sellers, split into WFS and seller-fulfilled.
Sellers
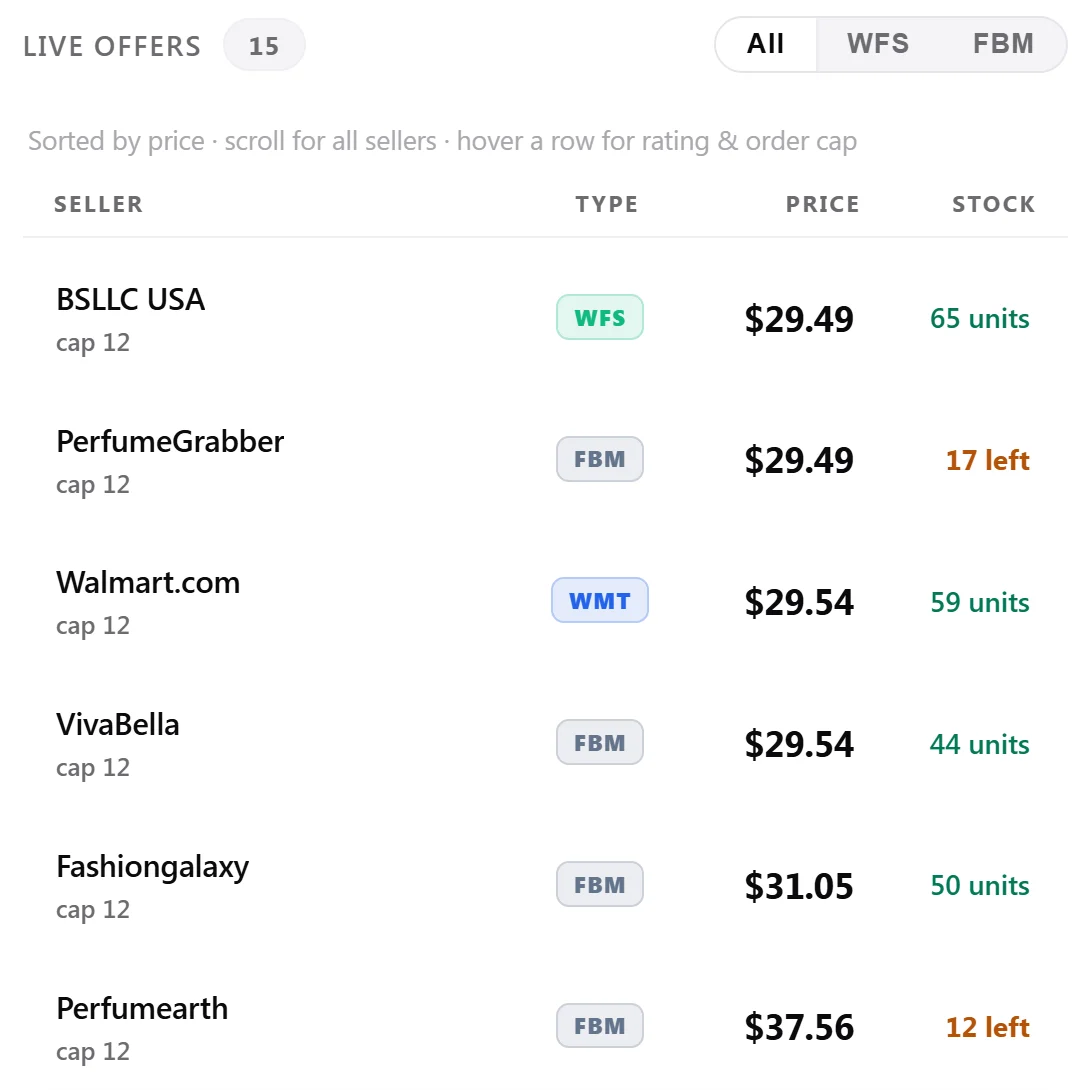
Every live offer with price, stock on hand and per-order caps — including Walmart.com itself.
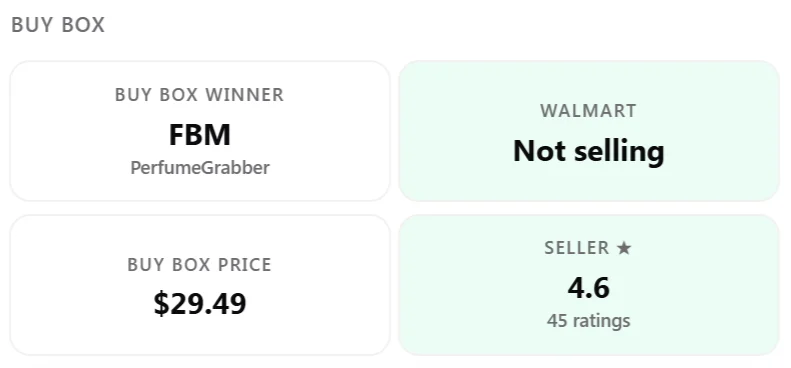
Buy Box
Who wins the box at what price, their seller rating — and whether Walmart itself is selling.
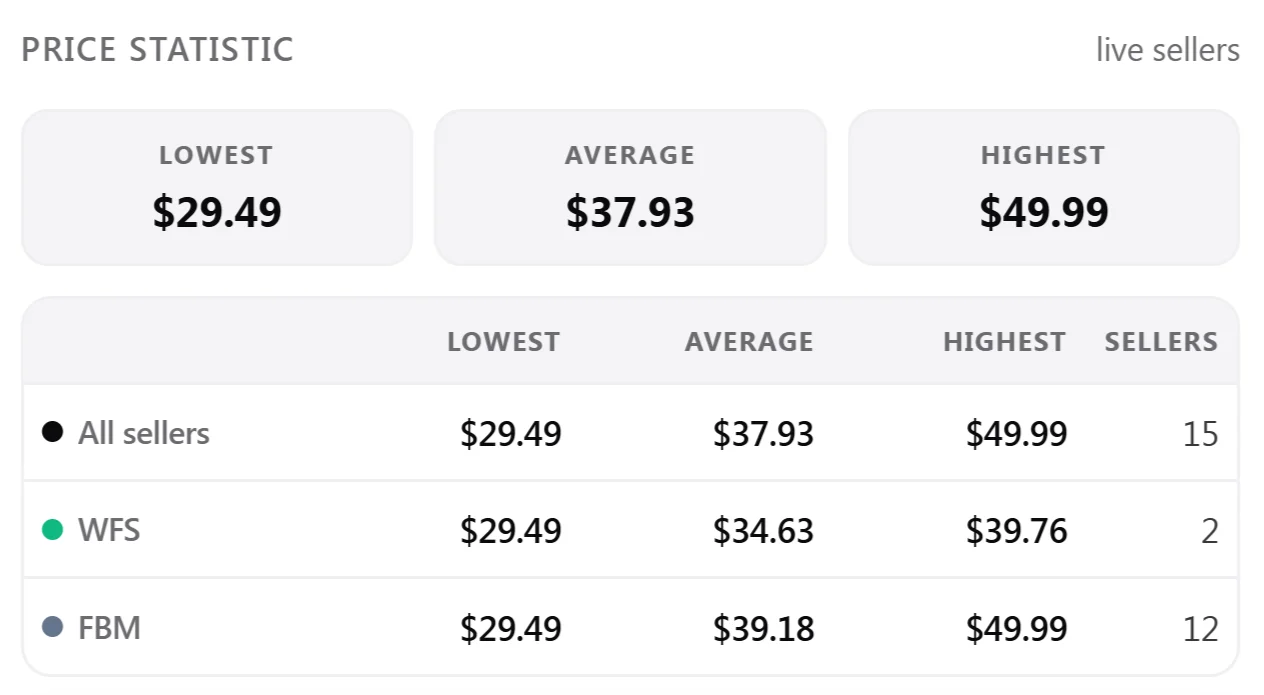
Price Statistic
Lowest, average and highest across live sellers, split by channel.
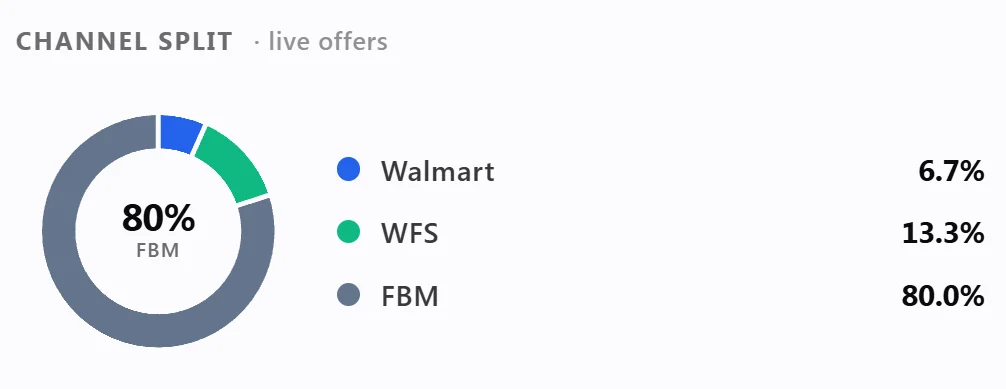
Channel Split
Walmart first-party, WFS and seller-fulfilled share of the live offers.
Research The Listing. Not Around It.
Install the panel, price the deal on either marketplace, and keep every lookup in sync with your iPhone and web workspace. 14-day free trial, cancel any time.